A. Market Overview
With the local and regional orientation of both existing and potential downtown establishments, the economic and demographic statistics for these areas provide a reference point for evaluation of current and potential demand that can be attracted from the local and regional marketplace.
Within the Capital Region are the cities of Albany, Rensselaer, Troy, Schenectady, Saratoga Springs, Cohoes, Watervliet, and Mechanicville.
One of the major strengths and opportunities for the Capital Region is the 75+ million population base within a 150-mile radius. Schenectady is within a half day's driving distance from several major cities including: Boston (3 hours), Buffalo (5 hours), Montreal (4 hours), New York City (3 hours), Philadelphia (4 hours), Rochester (4 hours), and Syracuse (2 hours). Smaller, but still significant, urban populations are clustered within a 1- to 1.5-hour's drive including: Cooperstown, Ft. Edward, Johnstown, Kingston, Lake George, Poughkeepsie, Saratoga Springs, Albany, and Troy.
In addition to the significant population base in the region, the Capital Region also enjoys a significant university/college base, which can play a major role in revitalizing downtown Schenectady if retail, entertainment, food, and beverage establishments are positioned to appeal to this key market segment. As shown in Table 1, there are over 44,000 students in the Capital Region.
| Table 1: Top 10 Two- and Four-Year Colleges and Universities | |||
|---|---|---|---|
| Name, Location | Total No. of Students FTEs | Years Offered | Public/Private |
| University at Albany, State University of NY, Albany | 13,700 | 4 | Public |
| Hudson Valley Community College, Troy | 6,766 | 2 | Public |
| Rensselaer Polytechnic Institute, Troy | 5,889 | 4 | Private |
| The Sage Colleges, Troy | 2,928 | 2 & 4 | Private |
| The College of St. Rose, Albany | 2,809 | 4 | Private |
| Siena College, Loudonville | 2,679 | 4 | Private |
| Skidmore College, Saratoga Springs | 2,352 | 4 | Private |
| Adirondack Community College, Queensbury | 2,348 | 2 | Public |
| Schenectady County Community College, Schenectady | 2,322 | 4 | Public |
| Skidmore College, Saratoga Springs | 2,352 | 4 | Private |
| Union College, Schenectady | 2,302 | 4 | Private |
| Total No. of Students | 44,105 | ||
Source: Capital District Business Review Book of Lists 1997-1998
B. Selected Demographic Statistics
According to the Sales & Marketing Management "1998 Survey of Buying Power," the local/regional market of Albany, Schenectady, and Troy (the "trade area" used by this authoritative source) has a population of 874,400, with an Effective Buying Income (EBI) of $14.06 billion, generated by 337,100 households. EBI is defined as money income, less personal tax and non-tax payments — a number often referred to as "disposable" or "after-tax" income. Schenectady County alone has a population that generates $2.37 billion in effective buying income. The combined Albany-Schenectady-Troy metro market ranks 68th in EBI out of 320 such markets nationally.
The median household EBI for Schenectady County is $34,190 while the City of Schenectady median EBI is $26,639. These figures compare favorably with other metro areas in New York State such as Troy (EBI $26,327), Rochester (EBI $24,368), Buffalo (EBI $21,366), and Albany (EBI $27,447).
Table 2 indicates that Schenectady County population growth is projected to be relatively flat between now and 2010. The population trends for Schenectady County are similar to overall regional trends. As major employers, such as the Department of Transportation, move into downtown and the livability of downtown Schenectady is continually enhanced and promoted, it is likely that downtown and the surrounding neighborhoods will realize a modest population increase over the next 10 years.
| Table 2: Capital Region Population Projections | |||||||||||
|---|---|---|---|---|---|---|---|---|---|---|---|
| Population | Population Projections | ||||||||||
| Summary | 1980 | 1985- | 1990 | 1995 | 2000 | 2005 | 2010 | 2015 | 2020 | 2025 | 2030 |
| Capital District | |||||||||||
| Albany County | 285,909 | 289,167 | 292,793 | 302,726 | 305,548 | 307,977 | 310,332 | 312,623 | 314,864 | 317,063 | 319,225 |
| Rensselaer County | 151,966 | 153,099 | 154,429 | 158,358 | 160,301 | 161,692 | 163,040 | 164,351 | 165,632 | 166,888 | 168,123 |
| Saratoga County | 153,759 | 166,509 | 181,276 | 194,449 | 201,847 | 208,269 | 214,084 | 219,406 | 224,481 | 229,364 | 234,085 |
| Schenectady County | 149,946 | 149,557 | 149,285 | 151,110 | 151,477 | 151,844 | 152,211 | 152,577 | 152,945 | 153,313 | 153,681 |
| Capital District Total | 741,580 | 758,332 | 777,783 | 806,643 | 819,173 | 829,782 | 839,667 | 848,957 | 857,922 | 866,628 | 875,114 |
Source: Capital District Regional Planning Commission
| Table 3: Schenectady County Population Projections | |||||||||||
|---|---|---|---|---|---|---|---|---|---|---|---|
| Population | Population Projections | ||||||||||
| Schenectady County | 1980 | 1985- | 1990 | 1995 | 2000 | 2005 | 2010 | 2015 | 2020 | 2025 | 2030 |
| Schenectady County | 149,946 | 149,557 | 149,285 | 151,110 | 151,477 | 151,844 | 152,211 | 152,577 | 152,945 | 153,313 | 153,681 |
| Town of Duanesburg | 4,729 | 5,081 | 5,474 | 6,004 | 6,379 | 6,647 | 6,906 | 7,157 | 7,401 | 7,639 | 7,873 |
| Village of Delanson | 448 | 402 | 361 | 370 | 368 | 366 | 364 | 364 | 362 | 360 | 359 |
| Remainder of T of Duanesburg | 4,281 | 4,679 | 5,113 | 5,634 | 6,011 | 6,281 | 6,542 | 6,793 | 7,039 | 7,279 | 7,514 |
| Town of Glenville | 28,519 | 28,644 | 28,771 | 29,173 | 29,283 | 29,401 | 29,501 | 29,593 | 29,676 | 29,749 | 29,816 |
| Village of Scotia | 7,280 | 7,319 | 7,359 | 7,494 | 7,485 | 7,482 | 7,477 | 7,474 | 7,472 | 7,468 | 7,465 |
| Remainder of T of Glenville | 21,239 | 21,325 | 21,412 | 21,679 | 21,798 | 21,919 | 22,024 | 22,119 | 22,204 | 22,281 | 22,351 |
| Town of Niskayuna | 17,471 | 18,242 | 19,048 | 19,932 | 20,314 | 20,663 | 20,993 | 21,307 | 21,606 | 21,897 | 22,176 |
| Town of Princetown | 1,804 | 1,914 | 2,031 | 2,200 | 2,262 | 2,321 | 2,374 | 2,426 | 2,473 | 2,518 | 2,561 |
| Town of Rotterdam | 29,451 | 28,918 | 28,395 | 28,383 | 28,405 | 28,442 | 28,475 | 28,500 | 28,523 | 28,542 | 28,558 |
| City of Schenectady | 67,972 | 66,758 | 65,566 | 65,418 | 64,834 | 64,370 | 63,962 | 63,594 | 63,266 | 62,968 | 62,697 |
Source: Capital District Regional Planning Commission
C. Trade Area Comparisons
The trade area from which retail, entertainment, food and beverage, hotels, and other commercial establishments obtain their market support is determined by a number of interacting factors including accessibility, limitations of driving/walking time and distance, the extent of physical barriers, ambiance, and the presence and location of competitive facilities. Different analysis sources use different statistical areas for several reasons. Consequently, this analysis makes reference to differing trade areas and statistical areas depending on the data source.
After examination of the physical and market characteristics of downtown Schenectady, as well as conducting interviews with retailers, realtors, entertainment operators, and other real estate development professionals, we have concluded that downtown Schenectady commercial/retail establishments have the potential to serve an array of consumer types. There is a sufficient residential population within a 2-mile radius to support a significant amount of convenience retail such as dry cleaners, tailors, drug stores, butchers, grocery stores, etc. At the same time, downtown's existing urban fabric provides a significant opportunity to evolve into a destination for the regional population base and the tourists who are already visiting other area attractions, such as Saratoga Springs, Cooperstown, and Lake George.
The 2-mile ring represents the primary market area for convenience goods, which are usually purchased very close to home. The 5- and 15-mile rings represent the secondary and tertiary market areas for specialty retail, entertainment, attractions, sporting events, restaurants, bars, museums, festivals, etc.
In order to benchmark the revitalization process, provide a frame of reference, and assist in the overall market analysis, we have compared the demographics of Schenectady, Albany, and Saratoga Springs in Tables 4 through 7.
Schenectady has the potential to be a key hub in the Capital Region and appears to be significantly underserved in terms of retail, entertainment, and restaurants considering the population base and relative wealth. Schenectady compares extremely favorably to Albany, the metro area's largest city, and Saratoga, which has the most vibrant downtown in the region.
Schenectady has a significant population base (60,828) within a 2-mile ring of State and Broadway, which is very comparable to downtown Albany (65,146) and significantly greater than Saratoga (19,060).
Saratoga Springs' successful downtown revitalization provides an excellent example for Schenectady as well as numerous market opportunities. However, it should be noted that there are major differences between the two cities in market characteristics, which will result in significantly different strategies and overall market orientation for Schenectady. For instance, Saratoga has been able to thrive over the past decade despite a 3.4% decrease in population from 1990 and 1998. Clearly, Saratoga's renaissance has not directly correlated to population, job, and income growth. In Schenectady, we feel it is critical to improve the livability of downtown and the surrounding neighborhoods, which will, in turn, reverse population trends. Unlike Saratoga, an important benchmark for Schenectady's downtown revitalization during the next 5 to 10 years will be population growth in the 2-mile ring.
The success of downtown Schenectady's revitalization will not be realized without a major effort to attract the 550,570 people who live within 15 miles of downtown to come into Schenectady for an array of reasons, such as attractions, shopping, and entertainment. Saratoga Springs has been extremely successful at positioning itself as the Capital Region's playground. Obviously, Saratoga enjoys, and will likely always enjoy, significantly more cachet than Schenectady. It is also home to Saratoga Race Course, a one-of-a-kind attraction that draws affluent visitors from all over the nation and the world. Schenectady, on the other hand, enjoys significant advantages for shorter excursions from the tertiary market, such as proximity to a population base that is 3.4 times the size of Saratoga, and a significantly greater downtown employment base that is growing. Schenectady also has the opportunity to serve as a secondary destination for visitors to Saratoga and other regional attractions by building on the existing downtown entertainment offering.
Resident demand in the primary market area (2-mile ring) in successful urban environments (e.g., Annapolis, Maryland; Alexandria, Virginia; Greenville, South Carolina; and Cooperstown and Saratoga Springs, New York) is rarely sufficient to provide the market support necessary to sustain restaurants, shops, services, and attractions that make an urban environment appealing and livable. As a result, downtowns need to be positioned to appeal to a variety of market segments.
The following describe how trade area income and wealth are measured:
Household wealth is a measure of financial well being by net worth of households, or assets minus debts. Income data deals with only one dimension of financial well being-income. Assets include such items as savings accounts, money market accounts, stocks, bonds, mutual funds, real estate, and the value of a business, motor vehicles, etc. Debts include such items as mortgages, credit card debt, and bank loans.
Per capita income is the mean income for the stated year, computed for every man, woman, and child in a particular area. It is derived by dividing the total income of a particular area by the total population. The income is presented in terms of current dollars for the particular year in question.
Household income is total money received in a stated calendar year by all household members 15 years old and over, tabulated for all households.
A review of the number of households and median household wealth in Schenectady's 2-mile ring indicates total household wealth of approximately $803 million compared to $235 million in Saratoga and $1.1 billion in Albany. These figures reveal that the population base within the 2-mile ring is a major asset that can be capitalized upon for additional neighborhood-serving retail and services.
Perhaps the most telling statistic is that Schenectady's 5-mile ring has $3.8 billion in total household wealth compared to Albany's $2.7 billion. This significant disparity does not exist in the 15-mile ring. This represents a major market opportunity for downtown and illustrates another major competitive advantage for downtown Schenectady establishments.
Schenectady has also enjoyed significant growth in median household income during the last decade. This growth has significantly outpaced Saratoga's growth in the 2-mile ring, and is four percentage points higher than both Albany's and Saratoga's 5-mile ring. Despite all of the negative perceptions that have been associated with the City of Schenectady's economic and socioeconomic conditions, the City's wealth and income growth indicate significantly more economic prosperity than is generally recognized.
The comparison of total income and growth in income clearly indicates that a vibrant downtown can be supported with considerably less resident spending power when combined with a focused effort to create the best possible atmosphere for both residents and visitors. Saratoga has invested in and managed its environment and capitalized on its numerous assets, such as historic preservation and key catalyst projects (e.g., the convention center and performing arts center). By focusing on serving both primary markets with convenience retail to enhance the livability of downtown, and combining the development of key catalysts/anchor projects, Schenectady can achieve similar success.
| Table 4: Population | |||
|---|---|---|---|
| 2-Mile Ring | 5-Mile Ring | 15-Mile Ring | |
| Schenectady | |||
| 1980 | 66,621 | 138,805 | 534,514 |
| 1990 | 64,666 | 137,848 | 548,343 |
| 1998 | 60,828 | 133,979 | 550,570 |
| 2003 | 58,478 | 130,991 | 548,498 |
| % Change: | |||
| 1998-2003 | -3.9% | -2.2% | -0.4% |
| 1990-1998 | -5.9% | -2.8% | 0.4% |
| 1980-1990 | -2.9% | -0.7% | 2.6% |
| Albany | |||
| 1980 | 66,584 | 173,727 | 540,602 |
| 1990 | 64,303 | 173,197 | 550,498 |
| 1998 | 65,146 | 175,565 | 551,234 |
| 2003 | 65,195 | 175,860 | 548,370 |
| % Change: | |||
| 1998-2003 | 0.1% | 0.2% | -0.5% |
| 1990-1998 | 1.3% | 1.4% | 0.1% |
| 1980-1990 | -3.4% | -0.3% | 1.8% |
| Saratoga | |||
| 1980 | 19,604 | 34,510 | 124,206 |
| 1990 | 19,729 | 39,587 | 145,947 |
| 1998 | 19,060 | 41,244 | 157,484 |
| 2003 | 18,750 | 41,991 | 162,648 |
| % Change: | |||
| 1998-2003 | -1.6% | 1.8% | 3.3% |
| 1990-1998 | -3.4% | 4.2% | 7.9% |
| 1980-1990 | 0.6% | 14.7% | 17.5% |
Note: Reference point for Schenectady is the intersection of State St. and Broadway, for Albany is Broadway and Clinton, and for Saratoga is Broadway and Congress.
Source: Claritas; Hunter Interests Inc.
| Table 5: Households | |||
|---|---|---|---|
| 2-Mile Ring | 5-Mile Ring | 15-Mile Ring | |
| Schenectady | |||
| 1980 | 27,129 | 52,120 | 197,776 |
| 1990 | 27,188 | 55,309 | 216,067 |
| 1998 | 26,038 | 54,599 | 220,746 |
| 2003 | 25,292 | 53,916 | 222,223 |
| % Change: | |||
| 1998-2003 | -2.9% | -1.3% | 0.7% |
| 1990-1998 | -4.2% | -1.3% | 2.2% |
| 1980-1990 | 0.2% | 5.3% | 9.4% |
| Albany | |||
| 1980 | 28,187 | 67,101 | 199,085 |
| 1990 | 28,390 | 70,622 | 216,075 |
| 1998 | 29,328 | 73,101 | 220,321 |
| 2003 | 29,665 | 74,020 | 221,550 |
| % Change: | |||
| 1998-2003 | 1.1% | 1.3% | 0.6% |
| 1990-1998 | 3.3% | 3.5% | 2.0% |
| 1980-1990 | 0.7% | 5.2% | 8.5% |
| Saratoga | |||
| 1980 | 7,232 | 11,913 | 41,646 |
| 1990 | 7,902 | 14,630 | 52,542 |
| 1998 | 7,935 | 15,715 | 58,279 |
| 2003 | 7,947 | 16,248 | 61,131 |
| % Change: | |||
| 1998-2003 | 0.2% | 3.4% | 4.9% |
| 1990-1998 | 0.4% | 7.4% | 10.9% |
| 1980-1990 | 9.3% | 22.8% | 26.2% |
Note: Reference point for Schenectady is the intersection of State St. and Broadway, for Albany is Broadway and Clinton, and for Saratoga is Broadway and Congress.
Source: Claritas; Hunter Interests Inc.
| Table 6: Median Household Wealth and Income | |||
|---|---|---|---|
| 2-Mile Ring | 5-Mile Ring | 15-Mile Ring | |
| Schenectady | |||
| Wealth: | $30,837 | $69,679 | $59,912 |
| Income: | |||
| 1989 | $24,836 | $30,946 | $32,683 |
| 1998 | $30,062 | $38,174 | $40,475 |
| % Change: | |||
| 1989-1998 | 21.0% | 23.4% | 23.8% |
| Albany | |||
| Wealth: | $15,622 | $37,711 | $59,205 |
| Income: | |||
| 1989 | $21,222 | $29,951 | $32,789 |
| 1998 | $25,470 | $35,653 | $40,517 |
| % Change: | |||
| 1989-1998 | 20.0% | 19.0% | 23.6% |
| Saratoga | |||
| Wealth: | $29,645 | $60,604 | $75,414 |
| Income: | |||
| 1989 | $21,222 | $29,951 | $32,789 |
| 1998 | $25,470 | $35,653 | $40,517 |
| % Change: | |||
| 1989-1998 | 20.0% | 19.0% | 23.6% |
| Income: | |||
| 1989 | $26,747 | $33,470 | $35,569 |
| 1998 | $29,798 | $39,963 | $41,939 |
| % Change: | |||
| 1989-1998 | 11.4% | 19.4% | 17.9% |
Note: Reference point for Schenectady is the intersection of State St. and Broadway, for Albany is Broadway and Clinton, and for Saratoga is Broadway and Congress.
Source: Claritas; Hunter Interests Inc.
| Table 7: Per Capita Income | |||
|---|---|---|---|
| 2-Mile Ring | 5-Mile Ring | 15-Mile Ring | |
| Schenectady | |||
| 1989 | $12,693 | $15,270 | $15,797 |
| 1998 | $17,002 | $20,767 | $21,123 |
| % Change: | |||
| 1989-1998 | 33.9% | 36.0% | 33.7% |
| Albany | |||
| 1989 | $12,164 | $15,388 | $15,734 |
| 1998 | $16,047 | $20,280 | $21,050 |
| % Change: | |||
| 1989-1998 | 31.9% | 31.8% | 33.8% |
| Saratoga | |||
| 1989 | $14,691 | $15,327 | $14,998 |
| 1998 | $18,737 | $20,326 | $19,538 |
| % Change: | |||
| 1989-1998 | 27.5% | 32.6% | 30.3% |
Note: Reference point for Schenectady is the intersection of State St. and Broadway, for Albany is Broadway and Clinton, and for Saratoga is Broadway and Congress.
Source: Claritas; Hunter Interests Inc.
| Table 8: 1998 Households by Household Wealth | ||||||
|---|---|---|---|---|---|---|
| 2-Mile Ring | ||||||
| Schenectady | % | Albany | % | Saratoga | % | |
| Total Households | 26,070 | 29,331 | 7,927 | |||
| Less than $25,000 | 12,471 | 47.8% | 18,048 | 61.5% | 3,837 | 48.4% |
| $25,000 to $49,999 | 2,347 | 9.0% | 2,564 | 8.7% | 705 | 8.9% |
| $50,000 to $99,999 | 3,438 | 13.2% | 3,078 | 10.5% | 1,017 | 12.8% |
| $100,000 to $249,999 | 4,841 | 18.6% | 3,616 | 12.3% | 1,443 | 18.2% |
| $250,000 to $499,999 | 2,028 | 7.8% | 1,418 | 4.8% | 631 | 8.0% |
| $500,000 and over | 913 | 3.5% | 602 | 2.1% | 303 | 3.8% |
| 5-Mile Ring | ||||||
| Total Households | 54,624 | 73,122 | 15,710 | |||
| Less than $25,000 | 19,459 | 35.6% | 33,334 | 45.6% | 5,919 | 37.7% |
| $25,000 to $49,999 | 4,701 | 8.6% | 6,325 | 8.6% | 1,437 | 9.1% |
| $50,000 to $99,999 | 7,978 | 14.6% | 9,305 | 12.7% | 2,367 | 15.1% |
| $100,000 to $249,999 | 13,015 | 23.8% | 13,826 | 18.9% | 3,604 | 22.9% |
| $250,000 to $499,999 | 6,246 | 11.4% | 6,714 | 9.2% | 1,621 | 10.3% |
| $500,000 and over | 3,201 | 5.9% | 3,596 | 4.9% | 768 | 4.9% |
| 15-Mile Ring | ||||||
| Total Households | 220,726 | 220,282 | 58,271 | |||
| Less than $25,000 | 84,911 | 38.5% | 85,302 | 38.7% | 18,739 | 32.2% |
| $25,000 to $49,999 | 19,276 | 8.7% | 19,167 | 8.7% | 5,514 | 9.5% |
| $50,000 to $99,999 | 31,208 | 14.1% | 30,918 | 14.0% | 9,612 | 16.5% |
| $100,000 to $249,999 | 49,109 | 22.2% | 48,729 | 22.1% | 14,905 | 25.6% |
| $250,000 to $499,999 | 23,874 | 10.8% | 23,820 | 10.8% | 6,538 | 11.2% |
| $500,000 and over | 12,288 | 5.6% | 12,386 | 5.6% | 2,969 | 5.1% |
Source: Hunter Interests Inc.; Claritas
D. Documentation of Downtown Physical Conditions
1. Regional Context
(Figure 16: Regional Context Diagram)
Downtown Schenectady is situated at the western gateway to the Capital Region (Albany, Troy, Schenectady, and Rotterdam) along the south side of the Mohawk River. Interstate 890, which skirts along the southern boundary of the downtown, is the primary vehicular access route from the southeast and northwest. State Route 5 (Albany Street/State Street) passes through the center of downtown and extends northwest to Scotia and southeast to Albany. State Route 50 intersects with State Route 5 on the north side of the Mohawk River and continues north to Saratoga. The downtown is well connected, with both local and regional bus and rail service.
Historically, much of the manufacturing and industrial development in the City was concentrated along the south bank of the Mohawk River with residential uses extending generally south and east from the river. While a number of manufacturing and industrial uses continue to exist along the northwest edge of the city, today, they are much less dependent on water and rail access and focus more on regional road and highway connections to the city.
2. Building Use Patterns Downtown
Downtown Schenectady is comprised of a wide variety of uses that primarily serve residents of the City and County and, to some extent, the Capital Region. While no single use dominates the downtown, there are noticeable patterns of building use. It is worth noting that the analysis of land and building use in the downtown identified only a single major public open space, Veteran's Park, which ironically is bounded by streets on each side. To improve this situation, the alternatives for the master plan and the final preferred plan incorporated projects that establish a better open space fabric for the downtown.
a. Residential
The Stockade neighborhood and Union Street corridor are two areas with the highest concentration of residential buildings. Most of these buildings are pre-1940s, single and multi-family residences. The exceptions are the new planned residential development on the north side of Liberty Street near Nott Terrace; the public housing along Veeder, south of Hamilton; Barney Square; and Mill Lane. While there is a remnant of single and multi-family residential uses south of State Street between Hamilton and Smith, this is clearly a neighborhood in transition. It is interesting to note the correlation between the pattern of residential uses and religious buildings in the downtown. For the most part, churches and religious uses are concentrated near the Stockade and Union Street neighborhoods. The notable exceptions are those religious uses on upper State Street and near City Hall. Union Street is also a mixed use area which can use additional retail to support its residential uses.
b. Retail and Entertainment
The strongest concentration of retail and entertainment uses is found along Erie and State Street, as well as along the Jay Street corridor. Some retail and entertainment uses have been developed in recent years on the periphery of the downtown. However, these uses seem to be sited to serve more auto-oriented patrons, rather than people arriving on foot. Downtown Schenectady lost a considerable amount of retail square footage to the suburbs during the past three decades.
c. Government
One of the most interesting patterns of building use is for state and municipal offices. City buildings, including City Hall, the police station, and the library, as well as the post office, are all located within a two-block area along Liberty Street. County offices and justice facilities are concentrated in an equally compact pattern along State Street near the intersection of Veeder. A third node of government uses has evolved over time near the intersection of Washington and State Street, and a fourth node is developing around the State/Broadway area.
d. Private Offices
For the most part, office uses are evenly distributed around the downtown. The one exception noted is a concentration of contemporary office buildings along Franklin Street between the City and County office concentrations. Many traditional downtown office users left downtown Schenectady during the past three decades.
e. Vacant Buildings
Downtown Schenectady has a large number of vacant or underutilized buildings. It is interesting to note the high concentration of vacancies along upper State Street. Explanations for the greater number of vacancies in this area are the age and physical limitations of many of these buildings and the characteristics of the sagging downtown economy. Not only are the floor plans and service facilities of these buildings less than adequate for modern office, retail, and residential use, but many buildings are in poor repair. The functional inefficiencies and declining condition are clearly issues that need to be addressed to attract future uses for these buildings.
f. Parking
One of the most disturbing findings of the Hunter/Sasaki team's analysis of land uses in Downtown Schenectady is the pattern of surface parking lots, as shown in Figure 13. Parking lots are perhaps the most dominant use in the City. The seemingly random pattern of paving in urban areas is a problem faced by many cities in today's automobile-oriented society. If, however, serious efforts are to be made in repairing the urban fabric of downtown Schenectady, a rational approach to land use that balances space for parking with space for pedestrians is necessary, along with creative off-hour use of surface parking lots.
g. Rail Initiatives
An important change in the Schenectady area which will have a significant impact on downtown Schenectady is a series of improvements in rail transportation, and improved linkages to other modes of travel through the planned Western Gateway Transportation Center in the heart of downtown Schenectady. With the introduction of high speed rail service to Schenectady and construction of the Western Gateway Transportation Center, downtown Schenectady will be a regional transportation hub involving linkage between intercity rail and bus service, local bus service, commuter rail, automobile, bicycle, and pedestrian traffic. Linked projects include renovation of the Saratoga Springs train station, construction of a second track between Rensselaer and Schenectady, construction of a new Rensselaer train station and the Commuter Rail Demonstration Project which is likely to use the Western Gateway Transportation Center. Appropriately, a transportation-related museum is planned to be included in the Western Gateway Transportation Center.
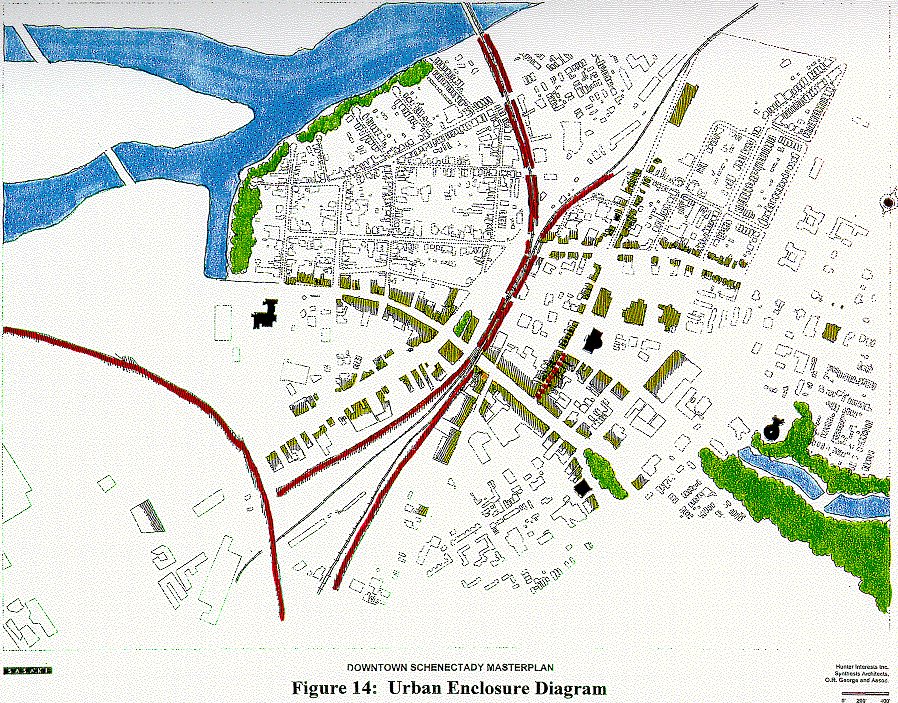
3. Urban Design Analysis
As part of the inventory phase of the master planning process, a series of diagrams were developed to illustrate the existing character of the civic fabric of the downtown. The Urban Enclosures Diagrams and urban structures are shown in Figures 14 and 15 and Figures 2 through 10. They study the way buildings frame streets and spaces in the study area, and show an "X-ray vision" of the downtown fabric. From this analysis we begin to see a number of strengths and weaknesses in the overall pattern of buildings in the downtown. These include:
- The continuous pattern of buildings with consistent setbacks from the street edge along State Street are a valuable asset in framing this important corridor in the city.
- Jay Street, from Union Street to State Street, is well defined on both sides of the street. The relationship of City Hall between Liberty and Franklin with Jay Street is emphasized by a slightly larger setback and the break in continuity with the buildings south of Franklin.
- Union Street is also a very positive asset from an urban design perspective. Buildings maintain a regular setback, and separation between buildings provides a clear hierarchical distinction with other streets in the study area.
- Erie Boulevard has a very ambiguous character because of the broken pattern of building development and excessive width of the street.
- The elevated railroad tracks bisecting the city are generally hidden in most parts of the downtown, the exception being where they cross streets. The railroad, since it is unlikely to be removed at any point in the future, needs to be reinforced as a visual and functional asset as opposed to a limitation.
- Nott Terrace is one of the most undefined corridors in the study area. Presently, it offers no contribution to the civic character of the downtown. The vast surface parking areas and orientation to automobiles have created a rift between the neighborhoods and open space assets southeast of the downtown.
- Interstate 890 is a prominent visual and functional barrier on the western edge of the downtown. Improvements to this edge will need to focus on points of connection under the highway at Broadway and Erie Boulevard.
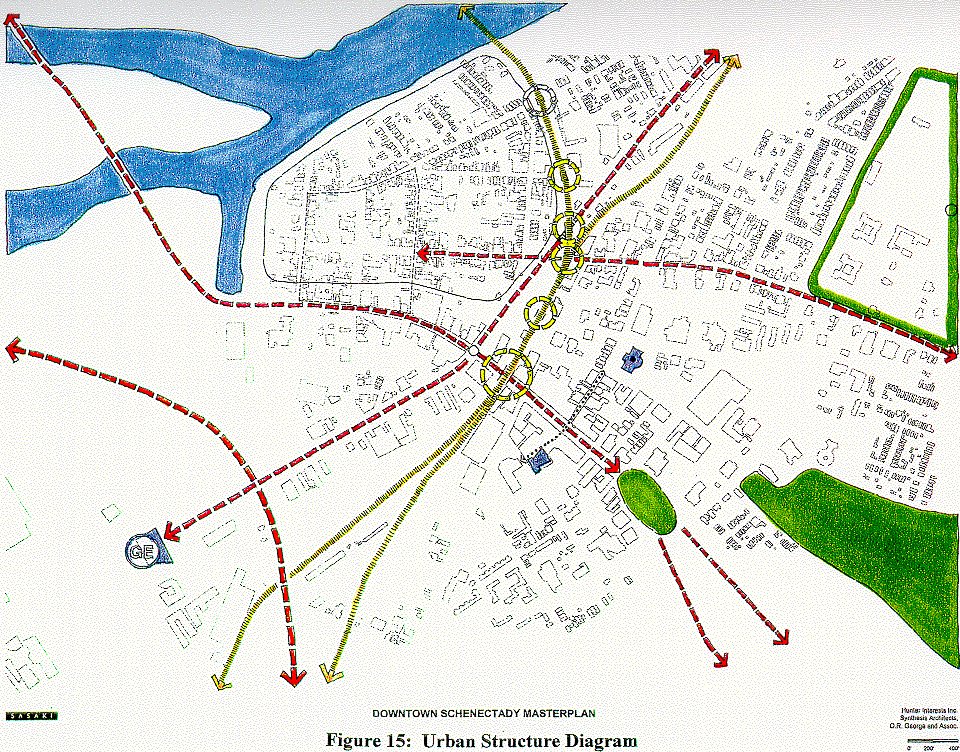
a. Urban Structure
The overall civic structure of downtown Schenectady is defined by a number of prominent corridors, spaces, and buildings. The civic structure ultimately provides the framework around which alternatives for projects and civic improvements will be placed. The elements illustrated in this diagram include:
Circulation Corridors — State Street, Erie Boulevard, Union Street, and I-890.
Open Spaces at Veteran's Park and Vale Park.
Important Community Destinations — City Hall, Proctor's Theater, Union College, and SCC.
Portals and Gateways created where the elevated railroad crosses streets.
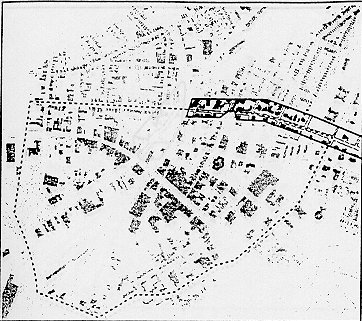
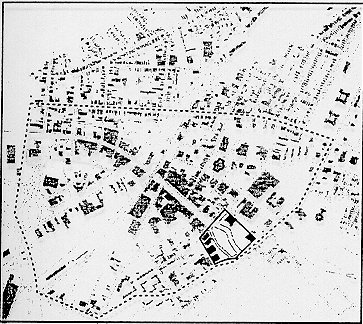
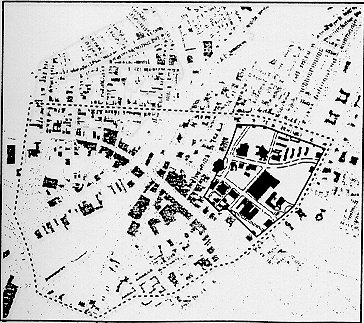
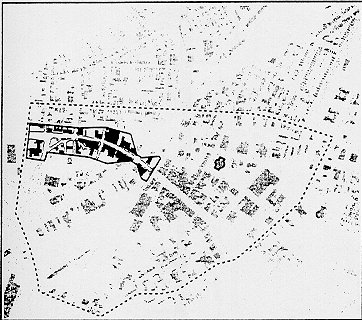
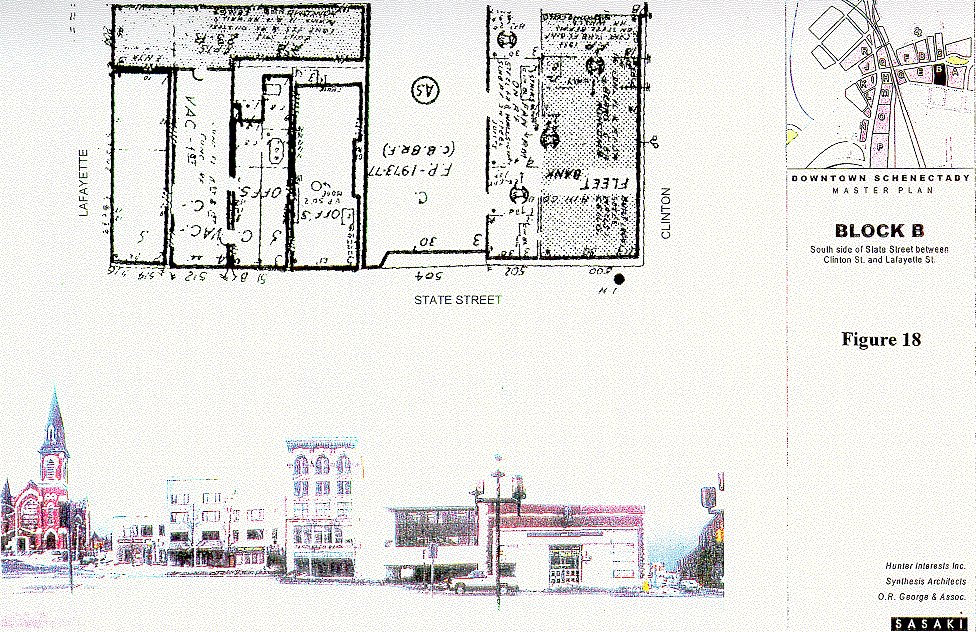
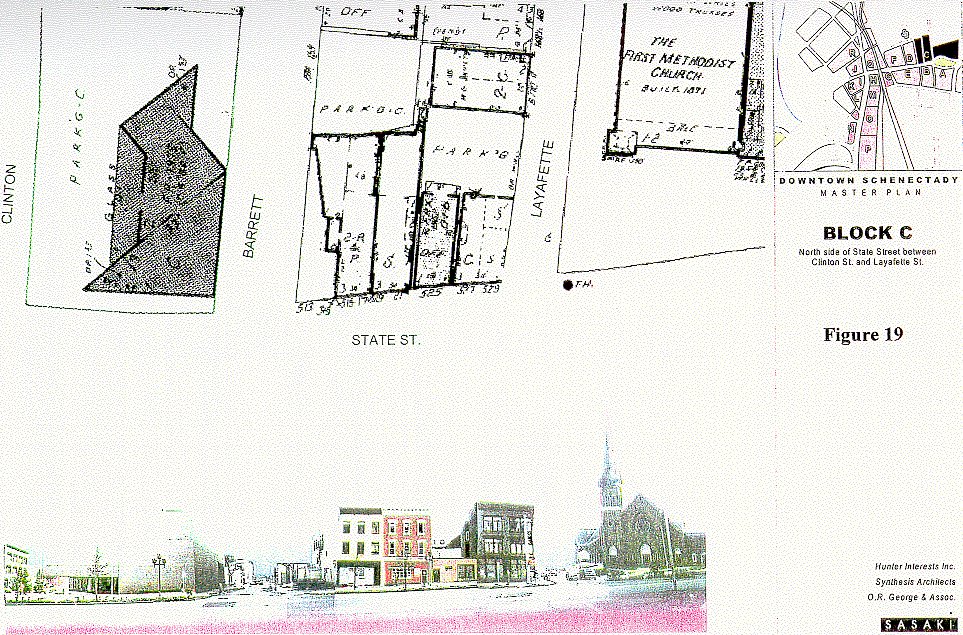
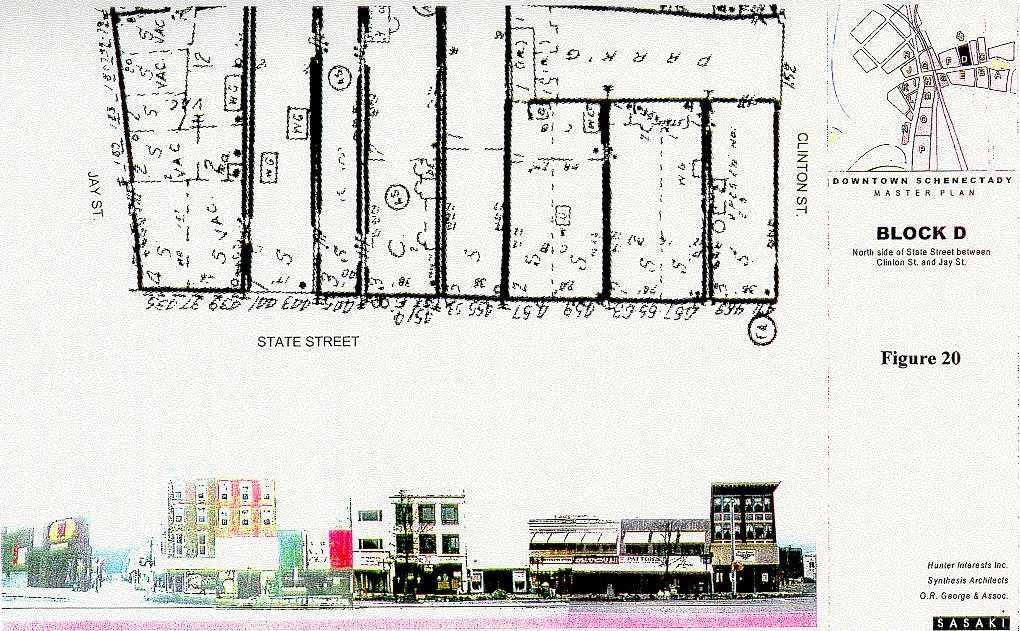
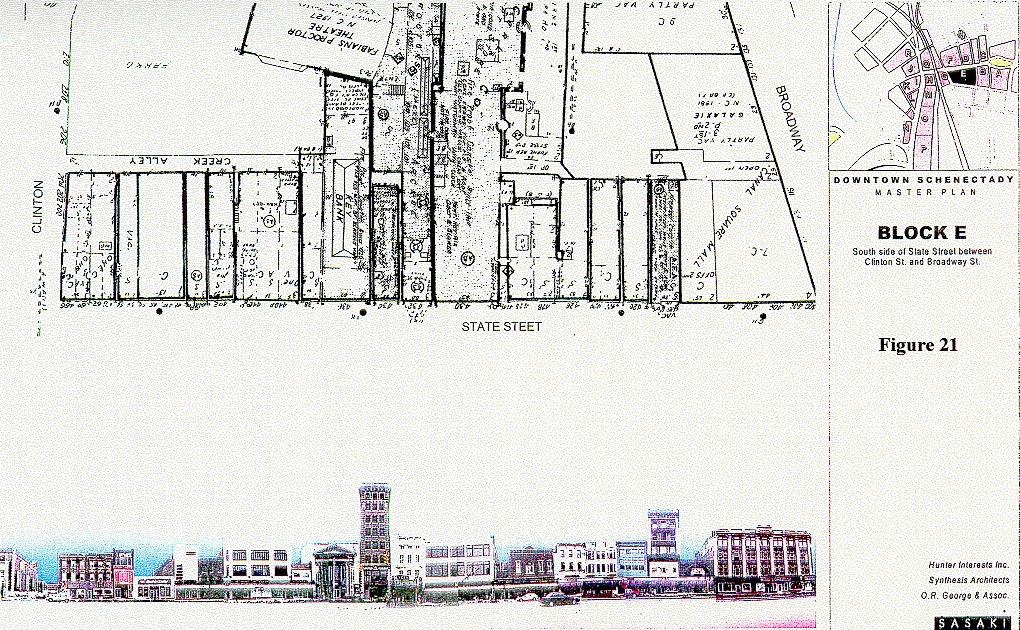
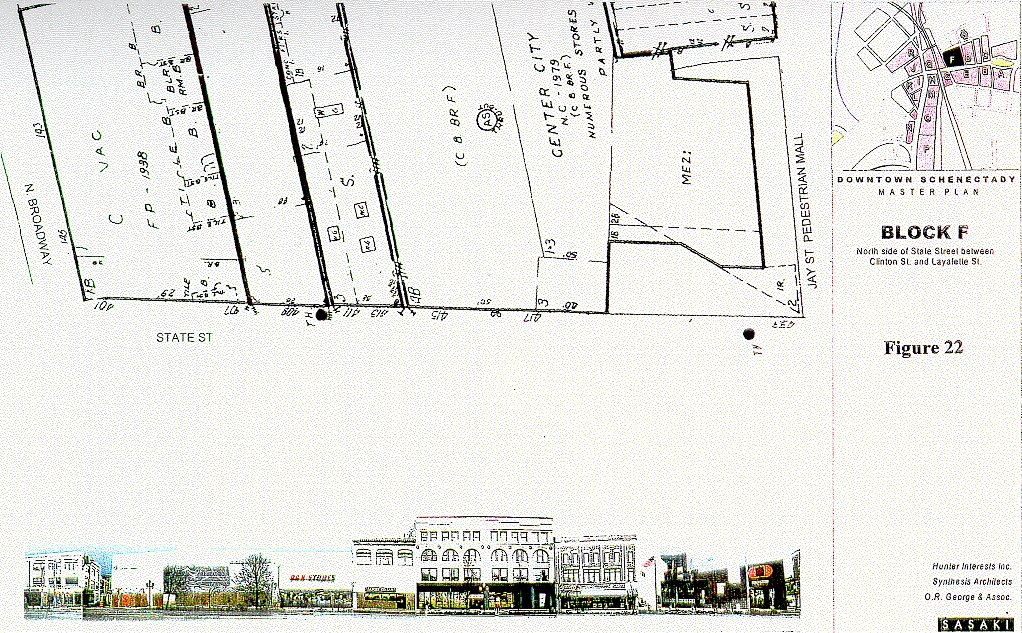
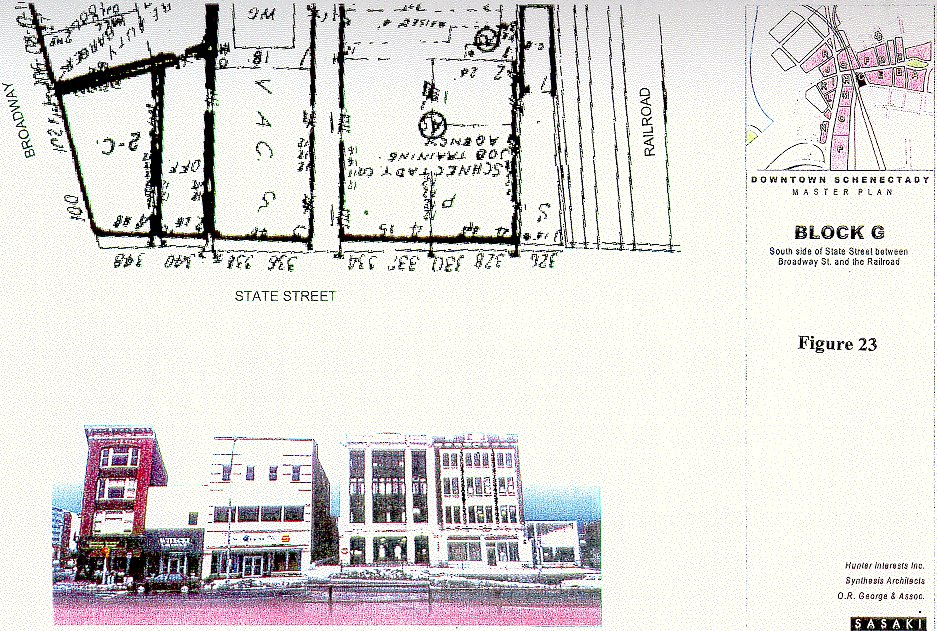
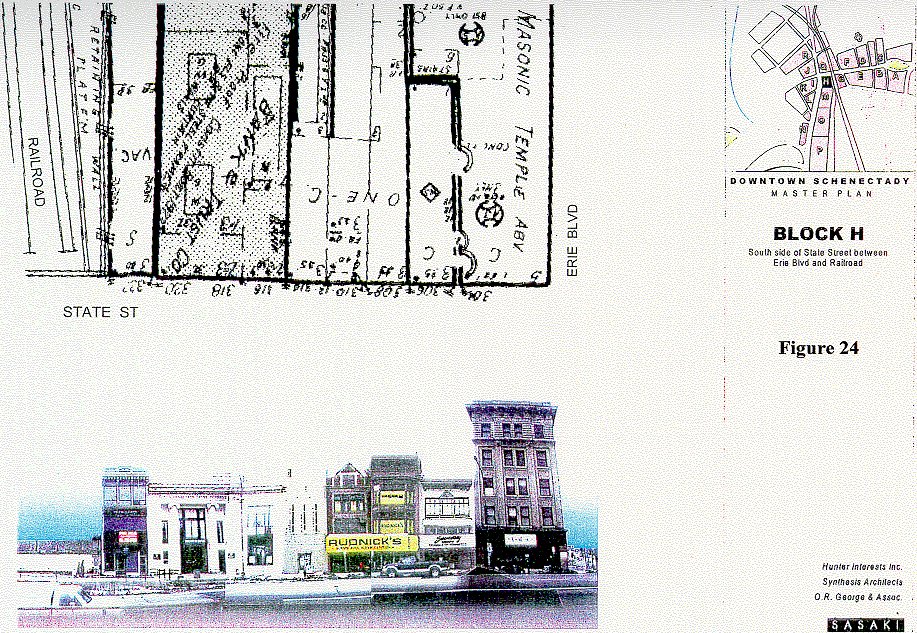
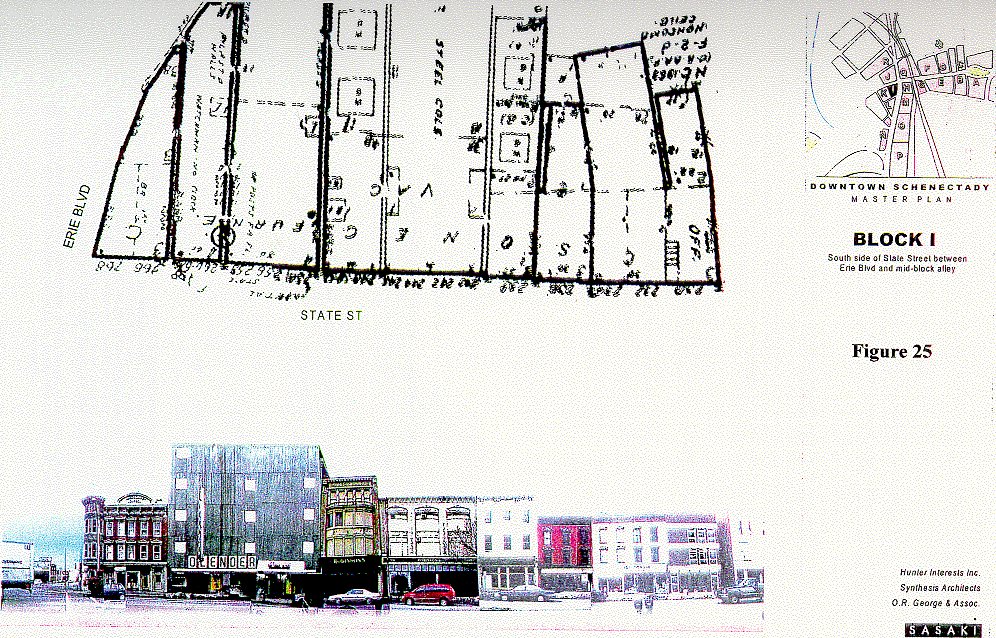
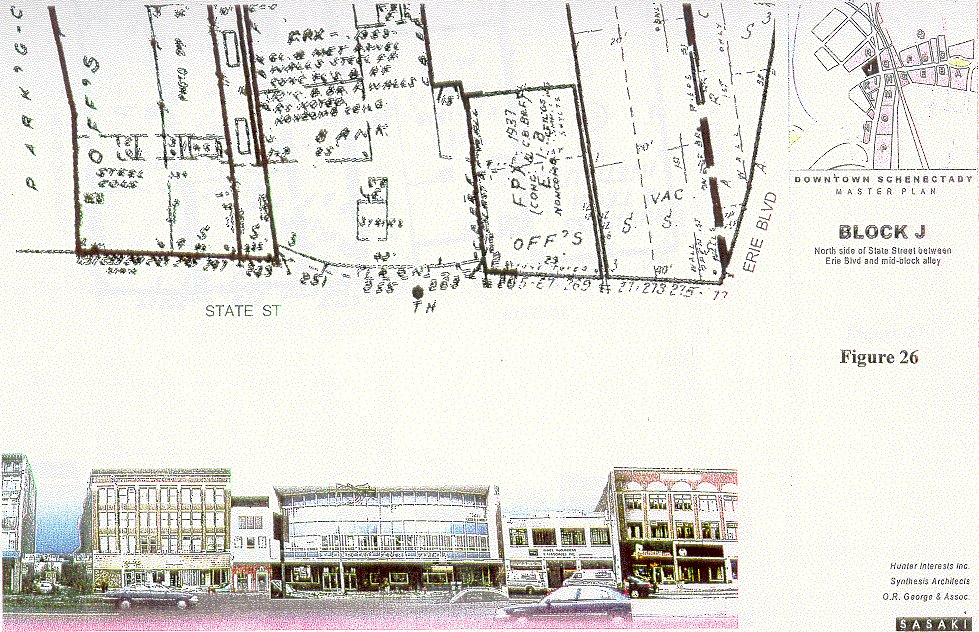
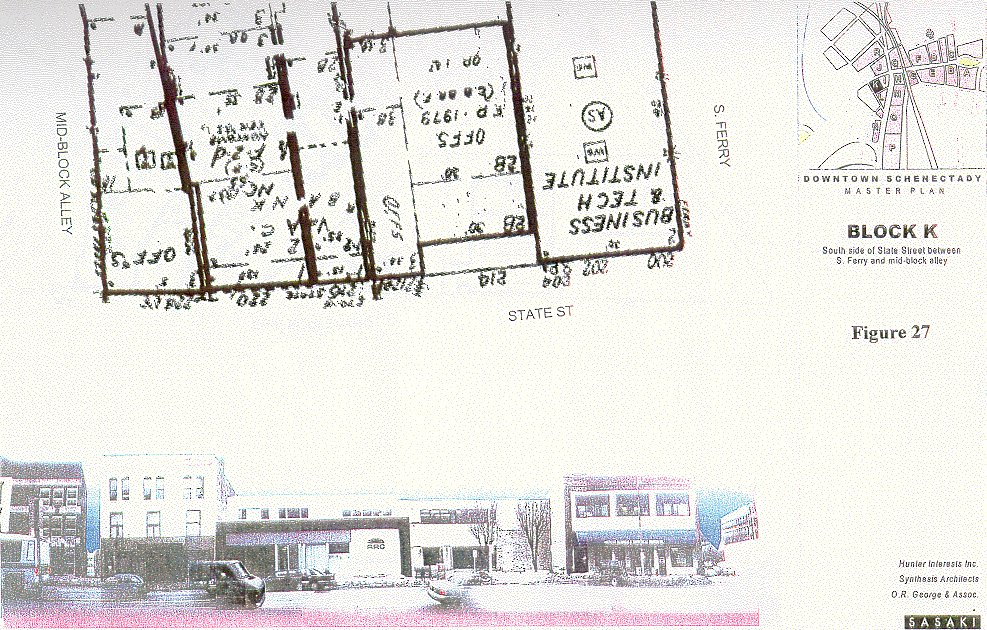
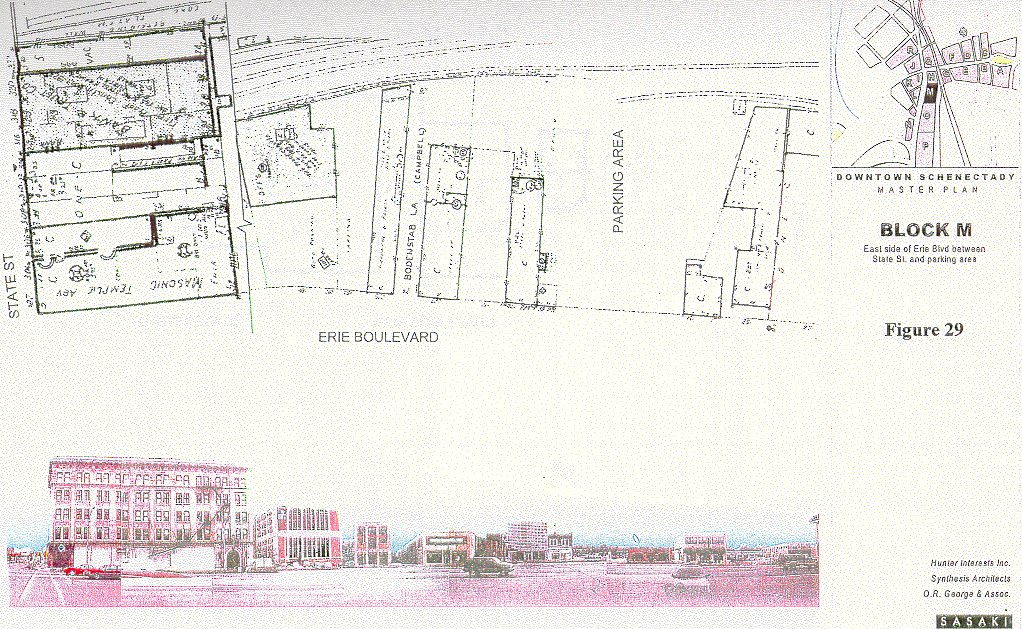
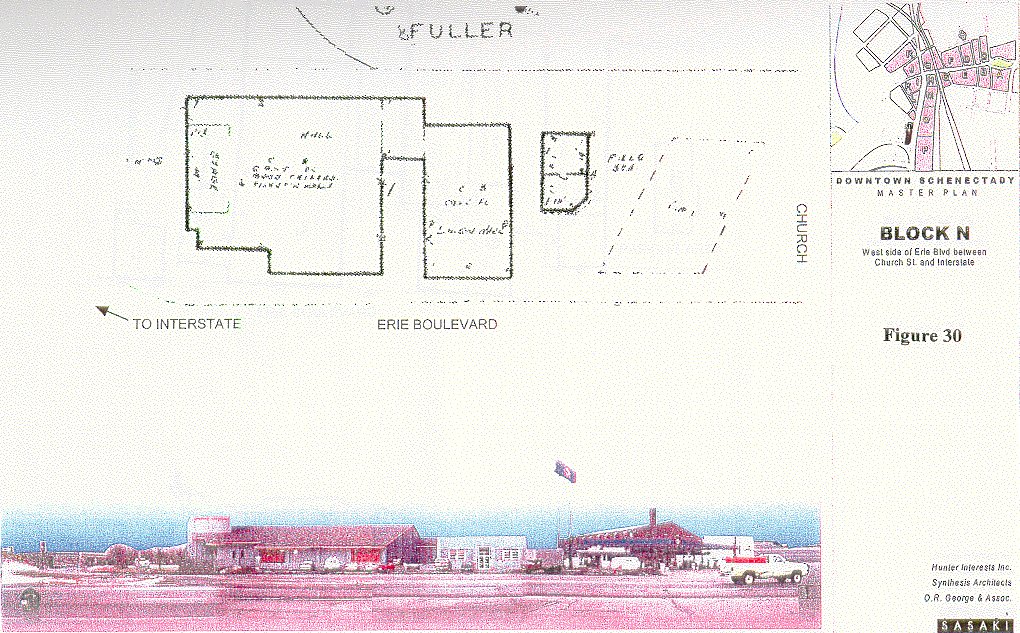
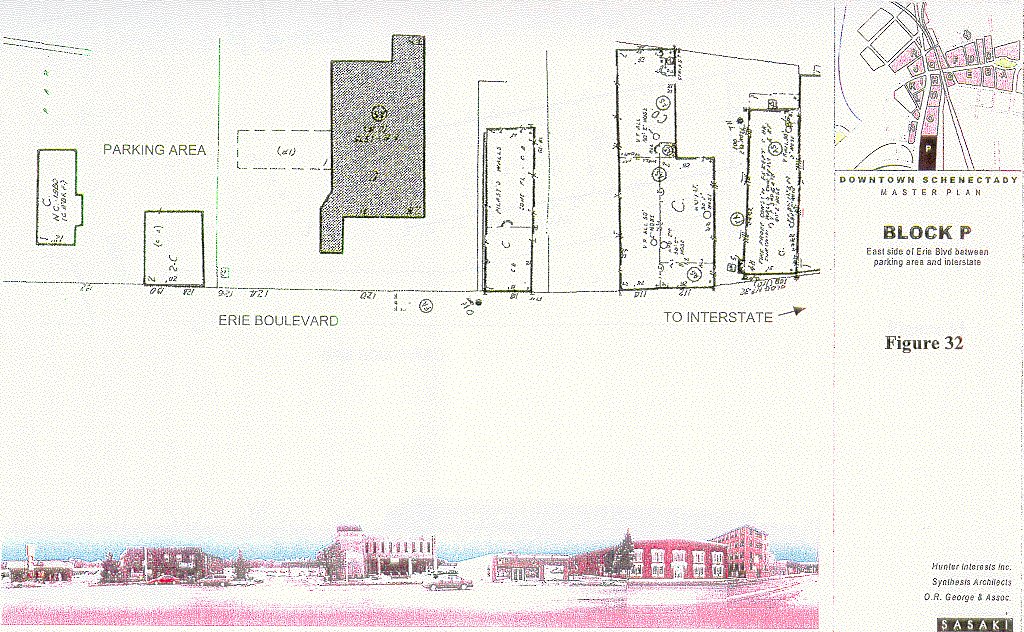
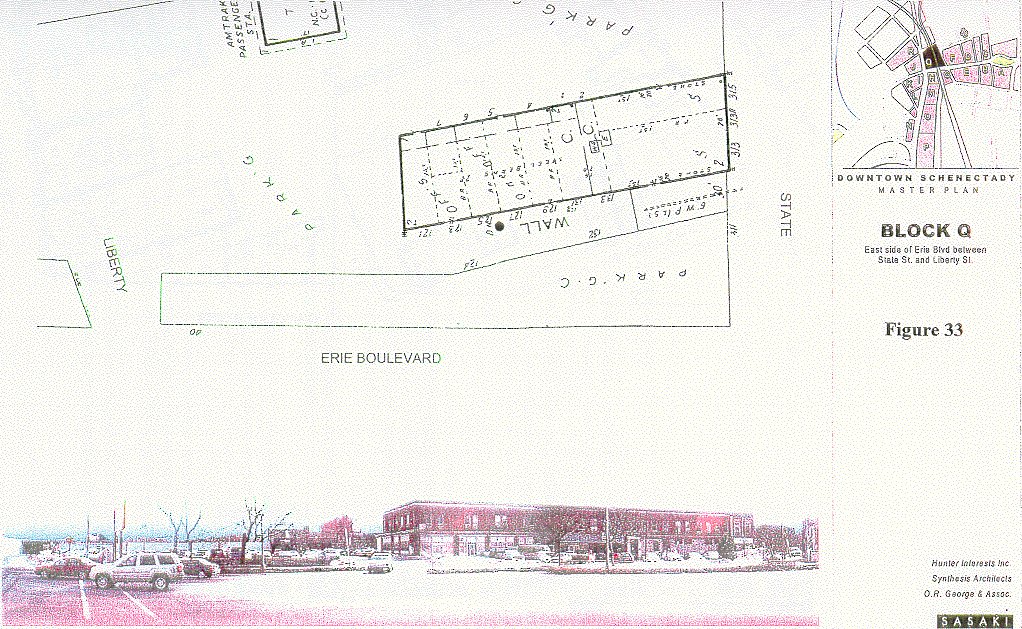
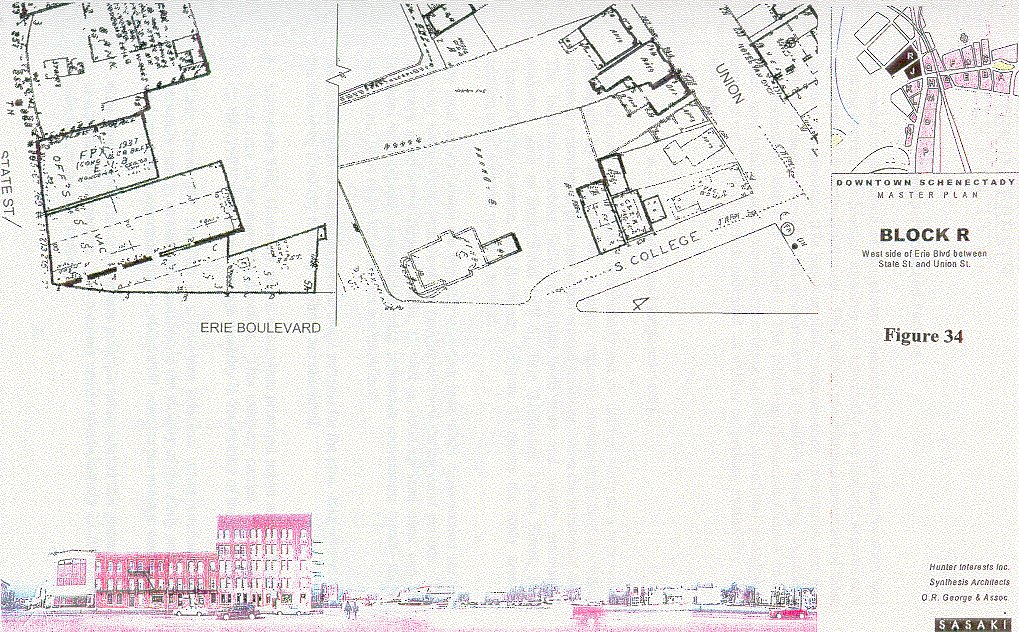
b. Analysis of Building Character
The inventory phase of the downtown master plan documented, in photographs and plans, existing buildings along Erie Boulevard and State Street. Figures 17 through 34 show part of this analysis. This information was used in identifying buildings and sites that should be preserved and protected and those that may be candidates for future redevelopment.
c. Street Sections
In an effort to document the range of street types that are found in the downtown, the team prepared sections of several streets in the study area. Several of these are shown in Figure 12. These sections are a useful tool in comparing and evaluating the character of these streets and are useful in developing models for improvement options for various streets in the district. For example, in comparing the section of Erie Boulevard to State Street it is evident that the design of State Street is more welcoming to pedestrians while Erie is oriented toward the automobile.
d. Urban Design Imperatives
Through this analysis, the following set of urban design imperatives was developed early in the master planning process and was shared with Schenectady citizens in two public forums. These imperatives guided development of alternatives for the master plan, and helped in the formulation of the final recommended plan. The diagrams, drawings, and illustrations described herein and shown on the following pages are examples of the various urban design analyses techniques used throughout this planning process. Larger versions of most analysis drawings were given to City staff to assist the continuing downtown analysis and planning process.
- The plan must create a fabric that knits the city together. This fabric will include elements such as pedestrian corridors, open spaces, buildings, and streets.
- Continuity in the "street wall" is extremely important — a continuous wall of building facades at the sidewalk without interruptions or buildings with setbacks, to frame and define the pedestrian way.
- First floors of buildings along important streets need to be activated with uses such as retail shops or service functions that have a regular flow of pedestrian traffic. Even in areas off the main streets, buildings need to reinforce the pedestrian nature of the street with doorways and building entrances.
- The plan needs to reinforce the "good" building facades and build around these. Where buildings with good facades are underutilized or vacant (such as the Hough Building) extra efforts should be made to increase their utilization and improve their physical condition.
- The impact of the automobile needs to be minimized. Use of surface parking should be discouraged, and wide streets such as Erie should be narrowed to improve the sense of scale for pedestrians. The plan must identify a land use strategy that supports shared use of parking.
- Erie, State, Broadway, Union, and Nott Terrace are important streets in the downtown that define the overall framework for the downtown. The plan must reinforce these corridors as important civic elements that hold the city together.
- The plan needs to recognize and reinforce the regional connections, including long-term benefits of public transportation access improvements.
Figure 2: Erie Boulevard
- Character
- Grand gesture — axis to GE
- Overly wide for current traffic and development
- Width of Erie and traffic speed make crossing at State very difficult
- Goals
- Underutilised sites on both sides of Erie represent great development opportunities for the city
- Narrow traffic way, introduce trees, widen sidewalks
- Historic character (Erie Canal) could be made visible
Figure 3: Upper State Street
- Character
- Wide street, heart of commercial city
- Many excellent 19th and early 20th century commercial buildings
- Many social services housed in former retail shops
- Recent development out of character with existing buildings
- Goals
- Arts and Entertainment focus
- Existing building facades should be maintained or restored for the most part
- New development must recognise context in massing, materials and fenestration
- New development should take place between or behind existing structures — galleria type development
Figure 4: Jay Street
- Character
- Intimate scale
- High quality commercial buildings
- Contrast between small scale of street and City Hall
- Pedestrian environment
- Goals
- Extend street enhancements (lighting, paving) past
- City Hall and Post Office
- Encourage small scale retail and restaurants
Figure 5: Union Street
- Character
- Mixed Use
- Residential Professional Offices
- Historic District
- Link between College and Stockade
- Goals
- Reinforce detached 2 storey homes
- Encourage Neighborhood commercial on corners
Figure 6: Veterans Park
- Character
- Green space, mature trees
- Civic buildings
- Park isolated by traffic
- Landscape looks worn
- Goals
- Infill vacant lots
- Hide parking
Figure 7: Civic Center
- Character
- Impressive grouping of high quality civic structures
- No coherent plan
- Streets overly wide for the traffic they carry
- Goals
- Create public open space that will enhance the civic buildings
- Group additional civic structures nearby
- Narrow streets
- Hide Parking
Figure 8: Station District
- Character
- Parking Lots
- Break in Urban Fabric
- Traffic
- Railroad Bridges
- Goals
- Provide an appropriate edge for Historic Stockade District
- Calm traffic on Erie Boulevard
- Provide for pedestrian crossings
- New intermodal facilities
- Turn railroad bridges into gateways rather than barriers
Figure 9: Lower State Street
- Character
- Sense of enclosure, intimacy — different from Upper State Street
- Narrow sidewalks
- Gentle curve adds mystery
- Excellent 19th and early 20th century commercial buildings
- Street wall breaks down at Community College and existing bus station
- Goals
- Existing building facades should be maintained for the most part
- Commercial activity should support the Stockade District
Figure 10: Stockade
- Perfect as is — preserve and enhance
- Redefine street frontage at Erie Boulevard railroad bridges
Figure 11: Broadway to Veeder
- Character
- Concentration of Government uses along Veeder
- Fragmented residential neighborhood
- Good residential complex at the corner of Hamilton and Veeder
- Too much surface parking
- Goals
- Strengthen Residential Character
- Streetscape improvements to Veeder
- Infill development on surface parking along Broadway and Clinton
Block-by-Block Existing Conditions (Figures 17-34): A | B | C | D | E | F | G | H | I | J | K | L | M | N | O | P | Q | R
4. Transportation and Parking
Successful revitalization of downtown Schenectady requires transportation and parking systems that function smoothly and efficiently, and properly support new and expanded downtown activities. This section presents an assessment of these facilities and services. It is based on field reconnaissance, inventories, and data collection/usage surveys as well as on reviews of available planning documents and discussions with City officials. The following discussion focuses on the study area location and accessibility, existing roadway operational situation in terms of the levels of service provided, as well as on parking availability, cost, and usage levels.
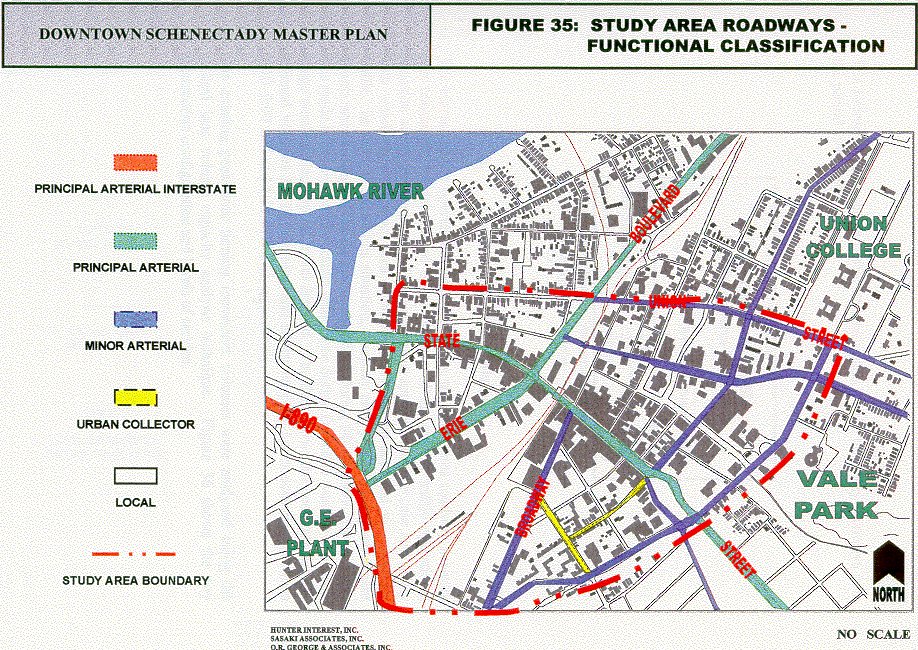
a. Location and Regional Access
Regional access to downtown Schenectady and the defined study area is provided principally by Interstate 890, a major regional freeway-type facility, which intersects a number of principal urban arterial facilities within the immediate area. The local/urban access facilities include both state and county maintained roadways, such as State Street (NY 5), Erie Boulevard, Union Street, Nott Terrace, Veeder Avenue, and Broadway. Figure 35 shows the study area in relation to the regional roadway network.
The local access streets are typically of a four-lane urban cross-section serving two-way traffic flow, with on-street parking allowed during most periods. The roadways noted serve through traffic, as well as abutting land uses; and are provided with adjacent sidewalks serving pedestrian movements typical for an urban area. Most major intersections are signalized.
As an indication of the traffic volume usage patterns for the area, descriptions of the following three key roadway facilities are presented.
- Interstate 890: Generally, this is a four-lane principal urban arterial facility, which runs in an east-west direction. This roadway carries approximately 42,700 (1997) vehicles per average weekday in the vicinity of the study area.
- State Street (NY 5): This is a four-lane principal urban arterial, which generally runs in an east-west direction in the vicinity of the study area. This roadway carries approximately 11,900 (1999) vehicles per average weekday.
- Erie Boulevard: This is a four-lane principal urban arterial that generally runs in a north-south direction. This roadway carries approximately 23,200 (1999) vehicles per average weekday.
The following table shows traffic volume trends for the three key roadways over the period 1994-1999.
| Table 9: Average Daily Traffic — Key Study Area Roadways | |||
|---|---|---|---|
| Average Daily Traffic | |||
| Roadway | 1994 | 1999 | |
| Erie Boulevard | 22,400 | 22,200 | |
| State Street (NY-5) | 12,500 | 11,900 | |
| Broadway | 7,800 | 7,300 | |
Source: Capital District Transportation Comm.; O. R. George & Associates
b. Local Access and Circulation
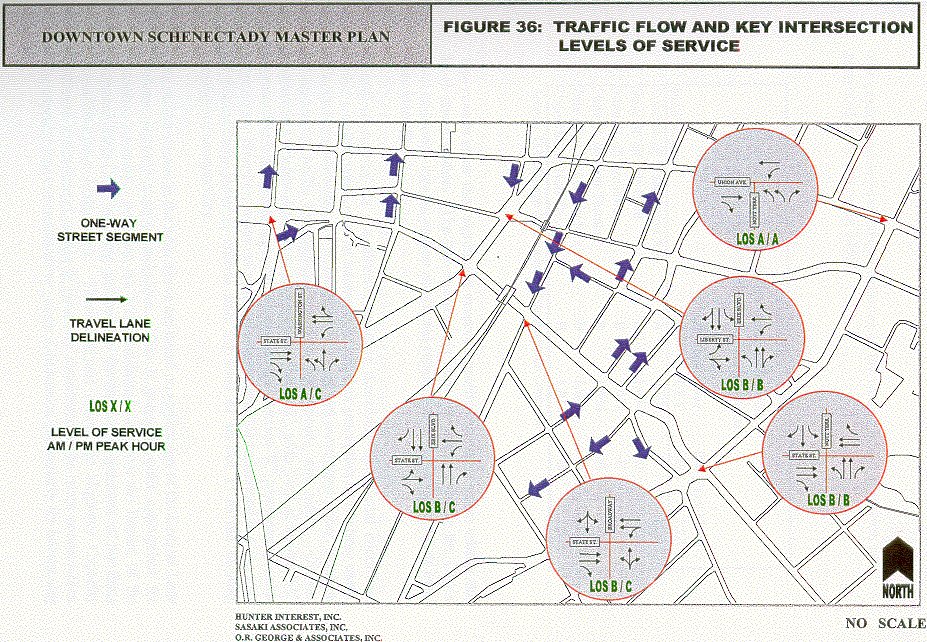
The current traffic operational situation within the study area roadway network can reasonably be determined by assessment of the current traffic operational situation at key intersections. This assessment approximates the ease and safety with which the downtown area of Schenectady can be accessed via vehicular traffic. In order to assess this situation, weekday peak period turning movement counts were conducted for six key intersections during March 1999. Every effort was made to ensure that the counts were taken during favorable weather and when usage would reflect typical travel demand. The data shows the peak intersection demand volumes for the morning and afternoon peak hours occurring between 7:30 — 9:00 a.m. and 4:15 — 5:45 p.m., respectively.
The existing peak hour turning movement volumes were analyzed using the critical lane volume capacity analysis technique. Figure 36 shows the key intersection configuration and levels of service.
The capacity analysis results, as indicated by the various levels of service, are presented in the following table:
| Table 10: Capacity Analysis Results — Key Study Area Intersections | ||||
|---|---|---|---|---|
| AM Peak Hour | PM Peak Hour | |||
| Intersection | LOS | CLV | LOS | CLV |
| State St. @ Washington Ave. | A | 693 | C | 1,244 |
| State St. @ Erie Blvd | B | 1,054 | C | 1,238 |
| State St. @ Broadway | B | 1,012 | C | 1,176 |
| State St. @ Nott Terrace | B | 1,036 | B | 1,068 |
| Erie Blvd. @ Liberty St. | B | 1,005 | B | 1,019 |
| Union St. @ Nott Ter. | B | 1,012 | B | 1,048 |
Source: O. R. George & Associates; Transportation Concepts.
The results show that significant reserve capacity currently exists within the local street system. The key intersections currently operate within the City's level of service criteria; and no significant capacity or operation constraints have been identified.
"Level of service" is a qualitative measure describing operational conditions within a traffic stream or at an intersection, and their perception by roadway users. Principal considerations are factors such as speed and travel time, delay, freedom of maneuver, traffic interruptions, comfort, convenience, and safety. Current engineering practice defines six levels of service (A-F), with level of service "A" representing best operating conditions, and level of service "F" representing worst conditions. Based on review of planning documents, it is understood that the City of Schenectady planning criteria calls for level of service D as the limiting standard of acceptability.
The results shown in the table above are based on application of the Critical Lane Volume capacity analysis technique. This is generally quite appropriate for planning purposes. Analyses are being conducted to assess the impact of the proposed State DOT building planned for the southwest quadrant of the State Street/Broadway intersection. These analyses utilize the Highway Capacity Software methodology, which is generally considered to be more conservative. The capacity analysis results show minor deficiencies, particularly for left-tuming movements at the two major intersections adjacent to the DOT site. This situation can be considered typical, since such a large project would normally require some off-site transportation system improvements, particularly within the immediate vicinity of the site.
c. Parking Facilities and Services
Parking provisions within the defined study area are seen as an essential, and perhaps critical, element to the successful revitalization of the Schenectady downtown area. As noted earlier, on-street parking is permitted along most roadways within the downtown area, all of which fall within the defined study area.
The principal factors that have a bearing on the usage levels for on-street parking are as follows:
- Location, particularly in relation to key land uses and associated activities;
- Time restrictions (all day, 2-hour, etc.); and
- Parking usage costs (i.e., free, metered, etc.).
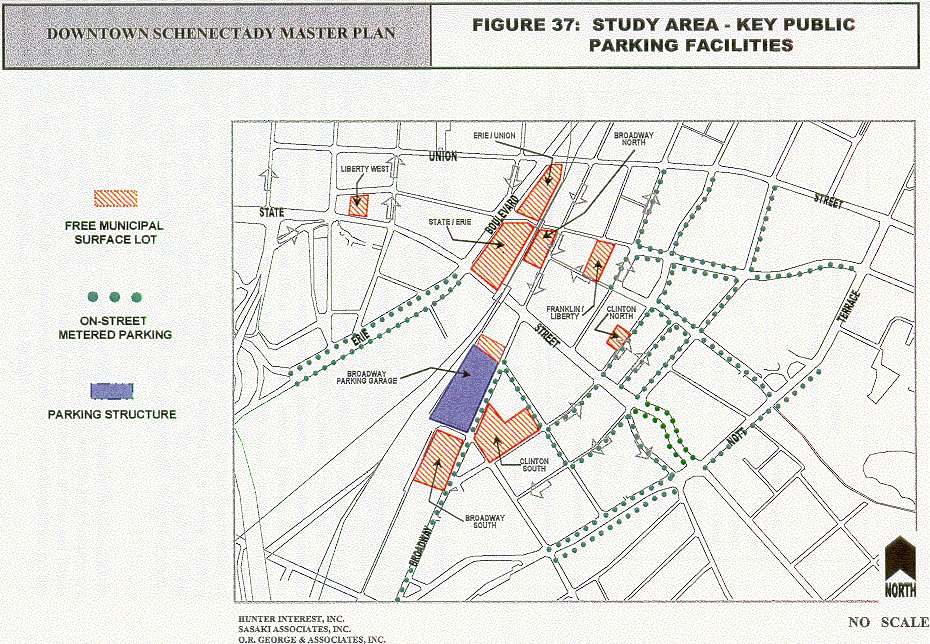
Figure 37 shows the location of public/municipal off-street parking within the study area. The time restrictions associated with the various on-street roadway segments range from 1-hour to 10-hour periods; with over 75% being restricted for 2-hour periods. The metered parking rates range between 25 cents to $2.50 for varying time periods.
Parking within the defined study area can be broadly categorized based on location (on street vs. off street), and by ownership and jurisdiction (public vs. private). Based on inventories conducted by the master plan study team and review of supplementary data provided by the City, there are currently approximately 9,170 +/- parking spaces within the study area. These can be categorized as follows:
| Category | Capacity |
|---|---|
| Public, Off Street (Free) | 1,247 |
| Public, Off Street (Pay) | 662 |
| Private, Off Street | 6,025 |
| On Street, Metered | 894 |
| On Street, Unmetered | 339 |
| Total | 9,167 |
The Downtown Special Assessment District (DSAD) is a public/private sector agency responsible for the management and operation of the free public parking lots located within Downtown Schenectady. The City also owns and operates the Broadway Parking Garage which has a capacity of 648 spaces administered through its Parking Facilities Division. The inventory of off-street parking and their rates/user characteristics are summarized in Table 11. Parking facilities are shown on Figure 37.
| Table 11: Downtown Schenectady Parking and Inventory Usage Summary | ||||
|---|---|---|---|---|
| Public/Municipal | Capacity | Usage | Fee/Restriction | |
| Broadway North | 61 | 54 | (86%) | Free/No Overnight |
| Broadway South | 333 | 156 | (47%) | Free/No Overnight |
| State & Erie | 143 | 110 | (77%) | Free/No Overnight |
| Clinton North | 62 | 56 | (90%) | Free/2-Hour |
| Franklin & Liberty | 60 | 32 | (53%) | Free/2-Hour |
| Liberty West | 26 | 24 | (92%) | Free/2-Hour |
| State & Erie | 47 | 13 | (27%) | Free/2-Hour |
| Clinton South | 183 | 103 | (56%) | Free/3-Hour |
| 124 Broadway | 14 | 6 | (43%) | Metered/2-Hour |
| Broadway Parking Garage | 647 | 231 | (36%) | Varying Rates/None |
| Total | 1,576 | 783 | (49.7%) | |
Source: City of Schenectady Parking Facilities Management Division; O.R. George & Associates; Edwards and Kelcey, Inc.; Hunter Interests Inc.
Table 11 includes usage rates, for the public/municipal off-street lots based on surveys conducted by the Hunter/Sasaki team during May and June 1999, and by the City during September 1999. Where appropriate, the maximum observed usage is indicated. As shown, off-street parking available to the general public in downtown Schenectady totals approximately 1,575 spaces and operates at approximately 50% capacity. However, these statistics do not mean that the downtown parking system functions well due to the location of these lots. Figure 37 shows downtown off-street parking clustered between Erie Boulevard and Broadway in the area north of State Street, and between Broadway and the Railroad tracks south of State Street. There is virtually no off-street parking for the eastern and western extremities of downtown Schenectady. Consequently, downtown Schenectady's primary public parking problem is not the number of off-street spaces, but rather, their location. For example, the entire western portion of downtown Schenectady is served only by the small Liberty West parking lot, and it only has 26 spaces. This small lot averages 86% occupancy, and is often at 100%.
Another problem is the amount of parking available for employees who park in the downtown area all day. Only three lots and the Broadway Parking Garage are available for all-day parkers, while six lots have a combination of two and threehour parking, mostly two-hour. Consequently, there are severe limitations on the availability of all-day parking, as well as its location.
It should also be noted that capacity figures can be deceiving. All-day parking can operate at capacities as high as 80% to 85% and be considered "at capacity" but hourly parking must function at lower capacities in order to accommodate surges in usage and provide convenience to users. Some parking experts consider 65% to 75% capacity in hourly parking lots to be the maximum at any point in time. These lots will accommodate many more cars than the number of spaces during an average day due to the turn-over factor.
As noted earlier, there are approximately 6,000 +/- private off-street parking spaces within the downtown area. These serve various commercial, retail, office, and other developments. A sample usage survey was made of sites representing approximately 50% of this parking supply. The results show overall usage in the range of 60%. When combined with the public lots, the amount of surface parking in downtown Schenectady breaks up the urban fabric of the downtown area.
In summary, current downtown parking problems include the amount of all-day parking and its location, and the location of off-street hourly parking. While this situation may not be critical in the eyes of some, it represents deficiencies and the need for correction that should be addressed to properly serve current parking demands. When new demands associated with elements in the plan are added, this analysis shows a critical need for additional parking at several key locations, specifically, the eastern extremity of State Street to serve the new MVP Building, and the need to expand the Broadway Parking Garage to properly serve the State DOT Building and the proposed cinema. Fortunately, the Broadway Parking Garage was constructed in a manner to allow addition of two more levels of parking which is important for the daily needs of the DOT Building, and considered critical for the evening demand generated by the proposed cinema complex.
d. Public Transportation Facilities and Services
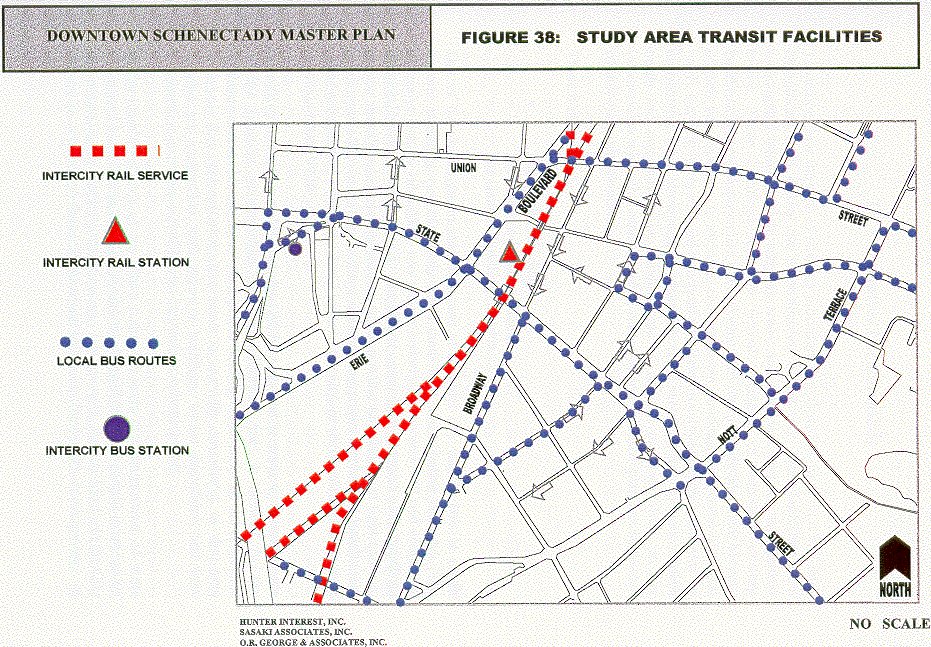
Development scenarios and usage types that were considered for the revitalization of Downtown Schenectady included office, entertainment, retail, residential, and visitor facilities. Therefore, consideration of existing and planned public transportation facilities is an important element of this study. The key public transportation services within Downtown Schenectady, and associated ridership characteristics, are as follows:
Intercity Rail:
- Three Amtrak routes serve the Downtown Schenectady station located at the southeast comer of the Erie Boulevard and Liberty Street intersection (i.e. the Empire Service, the Adirondack Service, and the Ethan Allen Service). These routes link the City with Albany to the east, New York City to the south, and with Montreal, Canada, to the north.
- Popular destinations for commuters are to New York City, Buffalo, and Montreal.
- Total annual ridership from the Schenectady Amtrak Station in FY 97 was 73,000 passengers. This represents a 9% increase over the FY 1996 ridership.
Intercity Bus:
- The Greyhound/Trailways Intercity Bus Terminal is located at the southeast comer of Washington Avenue and State Street intersection. This facility is served by nine buses per day, on Monday through Thursday; and two additional buses are operated daily between Friday and Sunday.
- The bus terminal is served by a major east-west urban arterial interstate (i.e., I890), with connections to Boston, Albany, Syracuse, Buffalo, and major urban areas to the west. It is estimated that a majority of the weekday services are to New York City, while weekend commuter activity is generated largely by area colleges.
Local Bus:
- Thirteen bus routes, operated by the Capital District Transportation Authority (CDTA), serve the Downtown Schenectady area.
- The CDTA Route 55 is the most significant route in the area, providing service between Downtown Schenectady and Downtown Albany. Route 55 has the highest ridership in the CDTA system, with 4,500 average weekday passengers.
- NY 5 (State Street/Central Avenue) has more than twice as many buses per day, relative to other bus transit routes within the Schenectady area; and provides service with 15- to 30-minute headways.
Figure 38 shows the key elements of the public transportation system serving Downtown Schenectady. With respect to convenience and quality of service, we note that most of the key roadways within the study area are served by bus routes. The service is provided with headways ranging between 10 and 15 minutes during the morning and afternoon peak hours, and 20 to 30 minutes during the off-peak periods. Based on discussions with CDTA planning staff, and sampled ridership checks, the current passenger demand is well within the system's capacity.
e. Summary and Conclusion
Transportation and parking facilities and the level of service that they provide to residents, patrons, employees, and other visitors are critical to the success of the City's revitalization program. Based on the foregoing data, analyses and evaluations, it has been concluded that downtown Schenectady is reasonably well served by existing transportation infrastructure and by public transportation facilities. Development proposals will necessarily need to be evaluated on a site-specific and sub-area basis, particularly with regard to immediate site accessibility and parking demands. However, no major constraints to the economic revitalization of the study area have been identified.